SCADA.web – Graphical evaluation of process data

SCADA.web - Graphical evaluation of process data 1

PRODUCT DESCRIPTION

SCADA.web is more than visualisation on the internet.

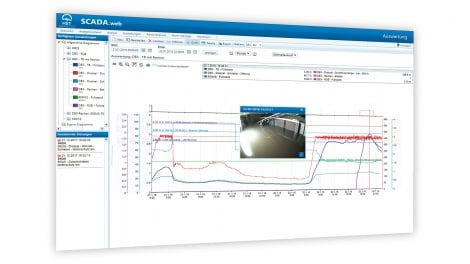
SCADA.web contains graphical analyses for the analysis of your process data. All process data are archived according to the delta event method and can be presented both graphically or in the form of tabular reports for any time periods desired.

The presentation of process values with accurate time, along with the camera images assigned to the same time provides a special form of analysis. With the help of the ruler, process values and the camera image archived at this time can be displayed simultaneously. Furthermore, there is also a photo gallery for the visual analysis of the plant available.

A special feature is the automatic sending of reports. You will automatically receive finished generated reports in the PDF format via e-mail. Simple and convenient – SCADA.web
Your benefits

  • Graphical hydrograph analysis
  • Temporal analysis of hydrographs and camera images
  • Photo gallery for visual analyses
  • Integrated reporting
  • Event reports for rainwater reservoirs
  • Automatic report sending via e-mail
  • Storage of evaluation reports

applications

  • Process optimisation
  • Diagnosis of incidents
  • Evidence of self-monitoring
SCADA.web - Graphical evaluation of process data 2
Result log
SCADA.web - Graphical evaluation of process data 3
HST TeleCam gallery
SCADA.web - Graphical evaluation of process data
SCADA.web - Graphical evaluation of process data 4

The presentation of process values with accurate time, along with the camera images assigned to the same time provides a special form of analysis

Product In-Stock: Available